Research & records
Journal & firm tools
Alongside the strategy-research pipeline, VeriRun Lab includes a full trading journal — logging, imports, attachments, playbooks and goals — plus tools for prop-firm traders: a provenance-checked firm-rules browser and an evaluation tracker. This page tours all of it.
The journal
The Journal section of the sidebar has sub-tabs for logging, dashboards, a calendar, analytics, insights, playbooks, planning and more. Start with the log.
Logging a trade
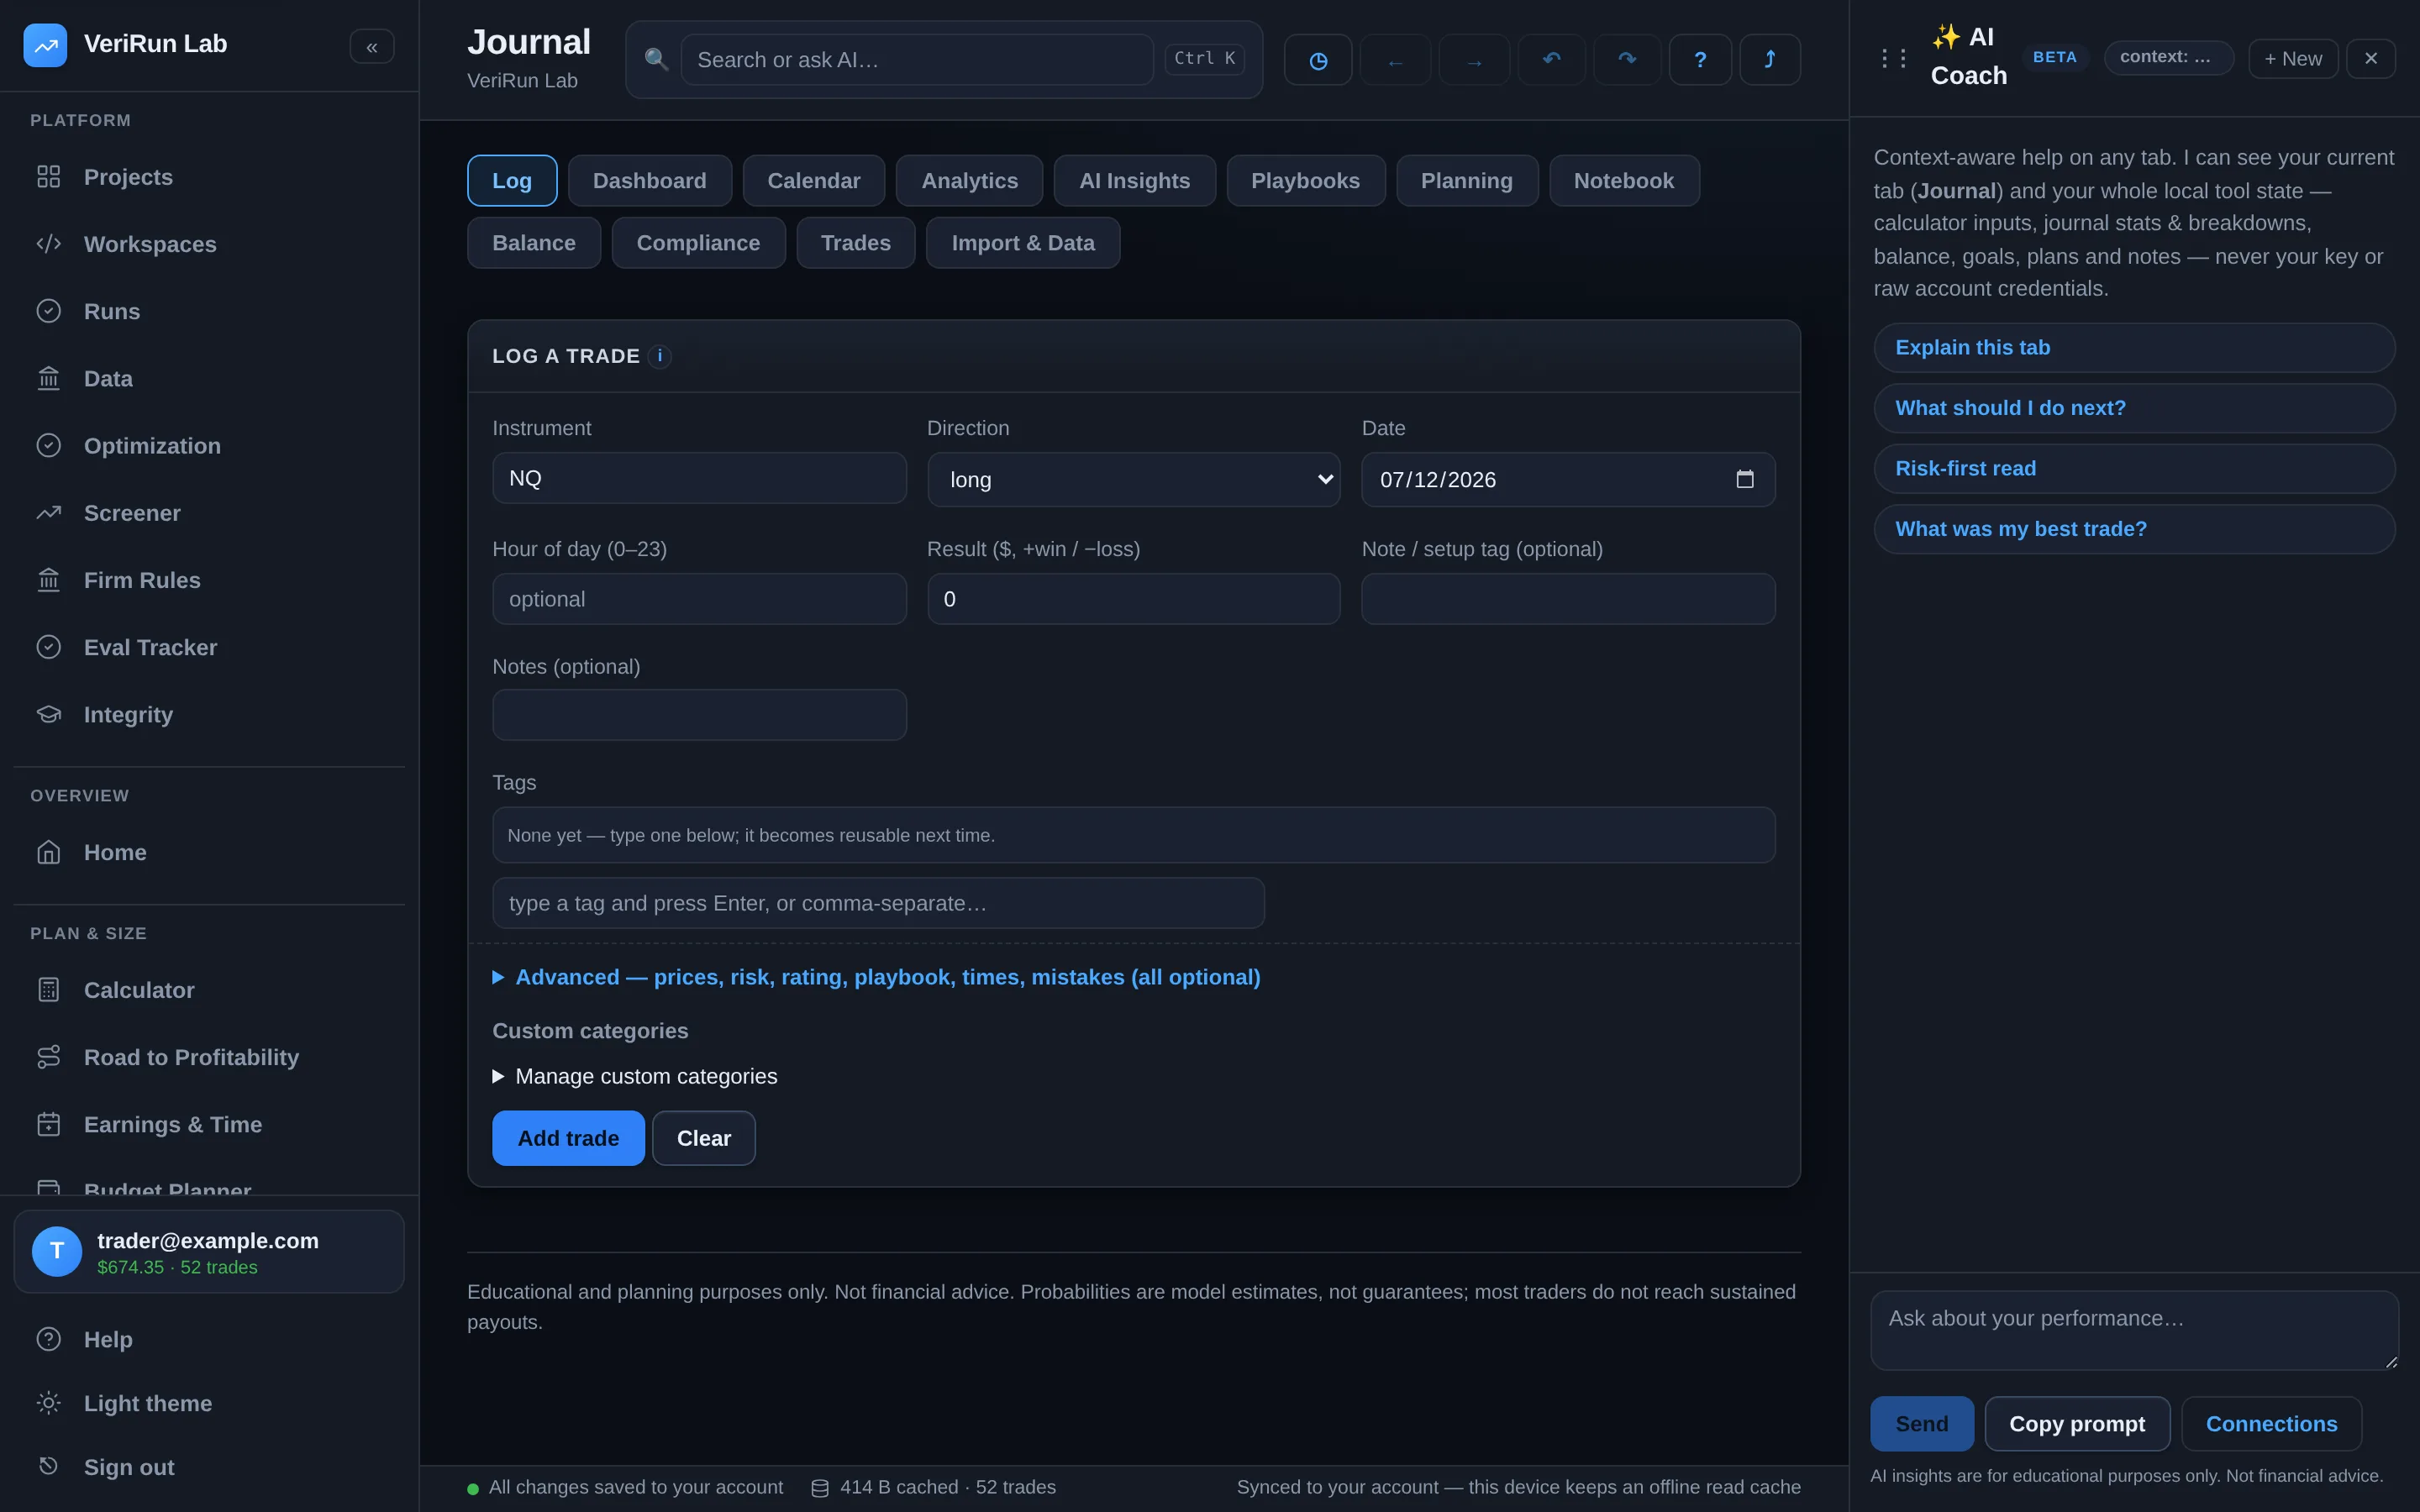
Log a trade keeps quick entry quick and detail optional. The core fields: instrument, direction (long/short), date, hour of day, result in dollars, a setup tag, notes and tags. An Advanced section adds everything a serious review wants: account label, quantity, entry/exit/stop/target prices, commissions, planned risk, entry and exit times, playbook, a 1–5 trade rating, mistakes, and your own custom categories. Press Add trade and it's in.
Edits are safe across devices: if you edit a trade that was saved from another device or tab after you loaded it, the app refuses to silently overwrite the newer version — it reloads the current trade and tells you, so you can reapply your change on top of what's actually there. Last save never silently wins.
Importing trades
-
Open Import & Data in the journal, and either drop a file or
paste rows. Supported files:
.csv,.tsv,.txt,.xlsx,.xls. Built-in readers cover common trading-platform fill grids and statistics or journal exports; Auto-detect (recommended) figures out the format, and a date-order option handles day-first vs month-first files. - Preview before committing. The import dry-runs first: “parsed 214 rows — 180 new, 34 duplicates (already in journal). Nothing imported yet.” Duplicates are detected and skipped, so re-importing an overlapping export is safe.
- Anything else via the column mapper. For any other spreadsheet, Import from any spreadsheet (map columns) lets you map your columns to journal fields — only a net-P&L column is required.
Each file becomes its own import batch, and batches can be removed as a unit in Manage imports if something came in wrong. Very large files are capped (about 25 MB per import) — split exports if you hit it. You can also export your whole journal as JSON or pull trades from a broker endpoint you configure. Cloud-storage backup (Google Drive / Dropbox) is built but not yet switched on — the Settings block says so until it is.
Attachments: screenshots and voice memos
- Open any trade to attach chart screenshots (PNG, JPEG, WebP, GIF) — drop them straight onto the trade — or record a voice memo for spoken review notes.
- Limits: 10 MB per file, and a total attachment allowance per account (the app tells you when you're near it; deleting attachments frees space).
Playbooks
A playbook is a named, reusable trade plan: a name (“ORB retest”), a description, and rules — one per line. Tag trades with a playbook when you log them (or later), and the Your playbooks panel scores each one: trades, win rate, expectancy, net P&L, with a comparison chart. This is how you learn which of your setups deserves size and which deserves retirement. Deleting a playbook never deletes its trades — they just become unattached.
Planning & goals
- Goals — pick a metric, a period (today / week / month / all-time) and a target; progress bars track you against it.
- Daily plan checklist — per-day items with an adherence score, and an adherence vs results view comparing your high-adherence days against low-adherence days. For most traders this chart is uncomfortably persuasive.
- Discipline challenges — self-imposed rules (“no trades after 11:30”) tracked as pass/violation.
Reality tracking — is live matching the backtest?
Once you trade a strategy (live or forward-test) and journal the trades, the platform can keep comparing your realized results against the strategy's backtest — and say, in a stored, dated verdict, whether reality is keeping the backtest's promise.
Linking a tag to a reference run
You create the link explicitly, from either side: the strategy page's
Reality panel (Link to journal tag…) or the
journal's trades tab (Link to platform strategy…). Either way you
enter the tag your live trades carry (say orb-v3-live) and pick the
reference backtest run — the run whose stored trades your
realized trades are scored against. The picker offers the runs from the
strategy's own lineage, newest first — minus any run already anchoring
another strategy's link — and the platform never infers a link from tag
names. Unlinking lives on the strategy page.
What gets compared
Scoring starts once 20 journaled trades carry the tag with a usable R multiple — below that the panel shows honest progress (Tracking (n = 12 of 20)), not conclusions. R comes from each trade's journaled dollar risk; trades without one fall back to a price-based derivation — entry-to-stop distance × quantity × the instrument's point value, using the engine's own contract specs — and trades with neither don't count. Four checks then run nightly and after every import:
- Expectancy — where your realized average R falls within what the backtest's own trades predict for a sample your size.
- Friction — your journaled fees per trade against the run's modeled per-trade cost. Journal a Planned entry price on a trade (the field next to Entry price, also mappable on CSV import) and the metric adds your intended-vs-fill slippage on top of fees — one-sided, so a fill that beat your plan never counts against you, and priced only for instruments the engine has contract specs for (ES/NQ/MES/MNQ; others contribute fees only). No fee data means the metric is excluded, with its reason listed — never guessed at.
- Win rate — whether your live win rate has fallen significantly below the backtest's. One-sided on purpose: outperforming live never counts against you.
- Shape — whether the distribution of your realized R values has drifted away from the backtest's.
Verdicts append; nothing is overwritten
- The roll-up — In line / Drifting / Diverged — appends as a dated version beside the reference run's audit history. The backtest's own verdict is never touched, and a quiet night appends nothing.
- If journal edits drop the sample below 20, the verdict becomes Suspended — never silently stale — and scoring resumes when the sample recovers.
- The panel's density strip shows the evidence at a glance: the backtest's R distribution with your realized trades overlaid on it.
- Diverged links straight to the fills comparison and the regimes view for the live period — the two usual explanations (costs, regime).
- Unlinking stops the re-scores and preserves every appended verdict as history. While a link is active, its reference run refuses purge — it anchors your reality tracking.
Excursions — MAE, MFE, and the trade chart
For every journaled trade the platform computes the two numbers most post-trade reviews turn on: MAE (maximum adverse excursion — how far the trade went against you before it closed) and MFE (maximum favorable excursion — the best it ever looked). The trade table carries both as columns, plus the derived ratios (MFE/MAE, exit efficiency — how much of the best available exit you actually captured).
Every excursion value states where it came from. A small glyph next to the numbers distinguishes: computed from the platform's market-data catalog · carried in by your import file · estimated client-side from your own bars · pending (not computed yet — opening the trade queues the computation automatically, and a Compute button remains for re-runs) · and the honest empty state: computed, but no data covered that session. “No data” and “not yet computed” are deliberately different answers — the journal never blurs them.
Opening a trade shows the trade chart: real candles for the session around your trade on a real time axis, entry and exit marked at their actual times, and — when your import carried them — the planned stop and target drawn as levels, so “did I follow the plan?” is visible at a glance. The chart loads clean — no indicators until you add them (VWAP and the rest sit one click away under Indicators, and your picks are remembered per trade). The chart footer names the data source and the exchange trade date it drew. Backfilling excursions over your history is free — it reads data the platform already has and never triggers a purchase.
Firm rules
The Firm Rules section is a browser of prop-firm rule sets built around one problem: rules change, and third-party summaries disagree. So every rule card shows its provenance — a verbatim quote, a link to the firm's own documentation, a retrieval date, and a verified / unverified badge. Where sources genuinely contradict each other, the conflict is surfaced, not silently resolved: you choose a reading — Strict (the safer default) or Lenient — and everything downstream is stamped with your choice.
The eval tracker
- Track an account. Pick the firm, the rule-set version (it is pinned, so later rule changes never silently alter your tracking), an account label — matching the account tag you use on journal trades — the account size and the start date. Press Start tracking.
- Resolve any rule conflicts the firm has (see above). Tracking won't start until every conflict has a chosen reading.
- Follow the lifecycle. The tracker moves through Evaluation active → Passed — awaiting funded account → Funded account → Payout eligible, with Breached and Closed as the exits. Events like Target met, Record breach and Payout processed are logged along the way.
Simulator outputs are estimates
Evaluation simulators run under the rule readings you chose and say so on every output: model estimates, not a promise of passing or payouts. The related Budget Planner section lets you model evaluation economics — profit target, drawdown, consistency caps, cost per attempt — before you spend real money on attempts.
The Calculator — prop-firm profitability from real trades
The Calculator models whether a strategy clears a prop firm's evaluation → funded → payout gauntlet. Beyond feeding it a modeled edge (win rate and reward:risk), you can replay an actual trade sequence through a firm's rules and see the money banked — payouts minus fees — not just a probability.
A Trade source toggle picks where those trades come from:
- Journal (the default) — replay the trades you actually logged, with their dates, direction, size and excursions carried through, so your own record answers the what-if.
- Backtest run — choose one of your completed backtest runs; its recorded trades are replayed through the firm lifecycle. This is the same trade data the run's own profitability view uses, so a research result flows straight into a prop-firm what-if without re-keying anything.
- Manual session — replay the trades you logged in a saved manual backtesting session.
Either way, every firm rule number comes from the provenance-checked firm-rules browser under the reading (Strict or Lenient) you chose, and the output is labelled an estimate — never a promise of passing or payout.
The AI Coach
The AI Coach section is the same AI Assistant you get from the side panel, opened on your trading. It is a full conversation with the assistant's own tools, which means it does not just see the numbers this browser has loaded — it can go and read anything in the app you can read, as you, through the same permission checks the screens use: your runs, your projects, your market-data coverage, your quotas and your journal. Quick coaching prompts drop a ready-made request into the message box; nothing is sent until you press Send.
It runs on your configured AI connection (Settings → AI keys) — your own provider key, or a platform-provided model where one is enabled — and spends from your AI credits like any other model call, with a balance you can see. Treat it as a review partner, not an oracle: it reasons from your journal, and it can be wrong.
Reading trades off chart screenshots
On the same section you can drop chart screenshots and have your AI read the entry, stop, target and exit off them. Each trade it finds is shown beside the exact image it was read from, so you check it before anything is saved; importing adds them to the journal as ordinary trades, and duplicates are skipped.
This needs a model that can actually see images. If the one you picked is text-only, the app says so and points you at the model picker — and there is always the offline path: copy the extraction prompt, run it in any AI that reads charts, and paste its answer back.
AI day recaps and trade notes
Two smaller writing helpers use the same connection. The journal's day view writes up the day you have selected — what happened, then the prioritised next steps — from that day's own numbers. A trade's detail panel drafts the note for that trade and can add it to the trade's notes; it appends, so it never overwrites what you wrote yourself. Both say which model answered, and both offer a copy-the-prompt path if you have no key connected.
Beyond the journal
The sidebar's other planning and learning sections — Road to Profitability, Earnings & Time, Budget Planner, Plan Lab, Risk Tools, the Futures Guide, Glossary and more — are self-explanatory interactive tools that share the journal's data where relevant. Explore them from the sidebar; each explains itself on screen.