Run & evaluate
Preview & Backtest
VeriRun Lab separates “show me what my strategy does” from “tell me whether it holds up”. Previews answer the first question with fast, idealized fills over a few sessions; backtests answer the second with deliberately conservative execution over the full window. Knowing which question each one answers is the key to reading both correctly.
Two run modes, two fill models
| Preview | Backtest | |
|---|---|---|
| Purpose | A teaching surface: see setups, entries, exits and annotations on a chart, fast. | Research-grade evidence: a graded result under pessimistic assumptions. |
| Scope | Bounded — up to 5 sessions. | The full window declared by the strategy's spec. |
| Fills | Idealized: a limit order fills when price touches it; a stop entry fills exactly at its trigger price. | Conservative: a limit order needs price to trade through it (someone actually traded past your price); maker orders are post-only; per-contract fees are charged; a triggered stop entry fills slightly worse than its trigger price. |
| Unlocks after | Tests green. | Tests green and the version explicitly approved. |
| Cost | Free — previews never consume credits. | Shows a credit estimate before launch. |
The app never lets you forget which one you're looking at. Every preview carries the banner “Preview uses idealized fills — full backtests apply conservative execution”, and every backtest result carries its method banner: “Conservative fills (trade-through required, maker post-only, per-contract fees). Research result — probabilities, not promises.”
A preview can also smoke-test the execution venue: the launch dialog’s checkbox “Also run one session through the execution venue (Layer 2, no grade)” — off by default — runs one of the preview’s sessions (the first with an idealized fill, else the first) through the conservative venue and shows that session’s orders and fills beside the preview’s counts on the run page, with a plain warning when the preview filled but the venue rested no order. It costs one extra sandbox session that shares the preview’s wall clock — the Layer-1 pass and the smoke together never exceed it, and the smoke is skipped (and says so) when too little of it is left — and stores no grade: the cheapest way to catch a strategy that previews well and backtests to nothing, before the full run.
A preview also refuses the order shapes a backtest cannot host, session by session: a market or stop-limit entry, or a position-management intent that is not a protective stop, a take-profit limit or a market exit. A full backtest refuses those before its engine starts; the preview now says the same sentence in seconds, with the fix named (resting limit or stop entries; protective stop plus take-profit limit), instead of letting the launch find it.
A preview also rehearses the backtest’s final benchmark stage. A full backtest ends by replaying your exits and declared target geometry through a random-entry control, and a strategy that runs clean session-by-session can still fail there — so the preview builds and resolves those same benchmark pieces against your strategy’s actual parameters up front. When that rehearsal hits the failure, the preview fails now, with the error and the fix named, instead of at the end of a full backtest. It is a rehearsal, not a proof: it resolves the benchmark pieces and replays one trade, so it catches the whole class of parameter-shape failures that used to surface only at the very end — it does not promise that every backtest which would fail there fails here. The control replays your exits over the same declared data streams your sessions read, and if it fails during a full backtest anyway, the backtest still finishes: the run keeps every trade, table and chart, the beats-random check is recorded as skipped and reads as failed (never as passed), and the run log says what failed and how to fix it. When a preview window has no trades (or no trade declares a finite stop/target), the summary says the benchmark stage was skipped and why — it is never silently assumed to pass. The run page shows the rehearsal as its own labelled line in the Summary section — passed, or not rehearsed with the reason and what to change — so you never have to read raw JSON to find out.
Optional: the realistic execution venue (diagnostic only)
Code-path backtests can opt into a third venue at launch: Realistic. Resting orders wait behind the displayed queue at their price and fill only as real prints consume it (possibly partially), and every order carries a fixed 150 ms decision→exchange delay — so it shows what queue position and latency would actually do to your entries. It is a diagnostics surface: a realistic run gets no scorecard grade (grades always come from the conservative tier), and the result pages label it “Diagnostic tier — not graded” everywhere.
Why the pessimism?
Optimistic fills are the classic way backtests flatter you: in real markets, the limit orders that fill effortlessly are disproportionately the ones you'll wish hadn't. Requiring trade-through, charging fees and filling stop entries with slippage means that when a strategy still looks good, the edge is less likely to be an artifact of the simulator. The gap between the two fill models is itself a diagnostic — see the fill-realism gap.
Launching a run
- Press Preview or Backtest in the workspace header. If the button is disabled, its tooltip names the reason (tests gate, missing version, missing approval).
- Review the launch dialog. For a preview you choose Sessions (up to 5) and optionally a tick limit. For a backtest, the window and data slice come from the strategy's versioned spec and are shown read-only — e.g. “Window: 2026-01-05 → 2026-03-27” with a coverage check. If part of the window has no data on the platform, the dialog says so before anything runs.
- The coverage check is per instrument. It asks the same question the runner enforces — is there data for this strategy’s instrument over this window — and the verdict names it, e.g. “2026-01-05 → 2026-03-27 · 58 sessions · full NQ.v.0 coverage”. A day only counts once its data is downloaded and built into the engine catalog. If the window has no data for that instrument, the dialog refuses, names the span that does have data, and gives you one click to jump to it — so a green preview and a failed run cannot disagree. A screener sweep, which runs once per instrument, requires the window to be covered for every instrument you selected. A strategy spec’s launch dialog asks the same question for every instrument the spec names, and the run stages exactly those instruments from the same catalog — a spec that names an instrument the platform has no data for is refused before it runs, on every path.
- Check the estimate. Backtests show Estimated cost (credits) — approximate compute minutes and credits, with an honest caveat that cost bases are estimates. See Data & credits for how to read it.
- Press Launch. The run is queued; its status chip moves through queued → running → succeeded (or failed / cancelled / timed out). You can leave the page — every run lands in the run library.
Why a run sits in queued
Platform background work — market-data downloads, catalog and report builds, the nightly passes — runs on its own worker, so it can never take the slot your test run, preview or backtest is waiting for. And queued runs are ordered round-robin between accounts: everybody's first queued run goes before anybody's second, so one busy account cannot push yours to the back. Your own runs keep the order you launched them in.
What genuinely does make a run wait:
- Memory. A backtest reserves more RAM than a preview, and both cannot be in flight at once on the same host. The run's event log says waiting for memory on the worker when this is the reason — or a catalog data build is running on this server when the platform is rebuilding its market-data catalog; either way the run starts on its own.
- Your own lane. One backtest at a time per account; a second starts when the first finishes.
Execution settings, parameters, and re-runs
Code-path (plugin) backtests carry three more launch controls, all optional — a blank field always keeps the platform default:
- Execution venue — Conservative (the grading tier) or Realistic (queue partials + fixed 150 ms latency; diagnostic-only, the run gets no scorecard grade).
- Execution settings — account size, commission per side, slippage ticks, and three clearly-labeled research-semantics choices: the entry working-window override, the Concurrent setups mode (default is one position per instrument; concurrent mode lets every confirmed setup work its own entry), and Contracts per trade (blank keeps the strategy's own sizing; a number sizes every entry on both kernels to that count and exits follow the position; a platform ceiling set by the administrator applies, and a launch above it is refused with the ceiling named). The three change which trades exist and how large they are, so results are not comparable with default-settings runs — everything you set is recorded in the run's manifest.
-
Strategy parameters — the dialog renders your
params_schemawith defaults as placeholders; only values you change travel with the run, validated at enqueue.
Code-path preview and backtest detail pages have Re-run with changes: it reopens the launch dialog prefilled with that run's window, parameters, venue, and execution settings, and the new run records which run it was seeded from.
Reading the chart
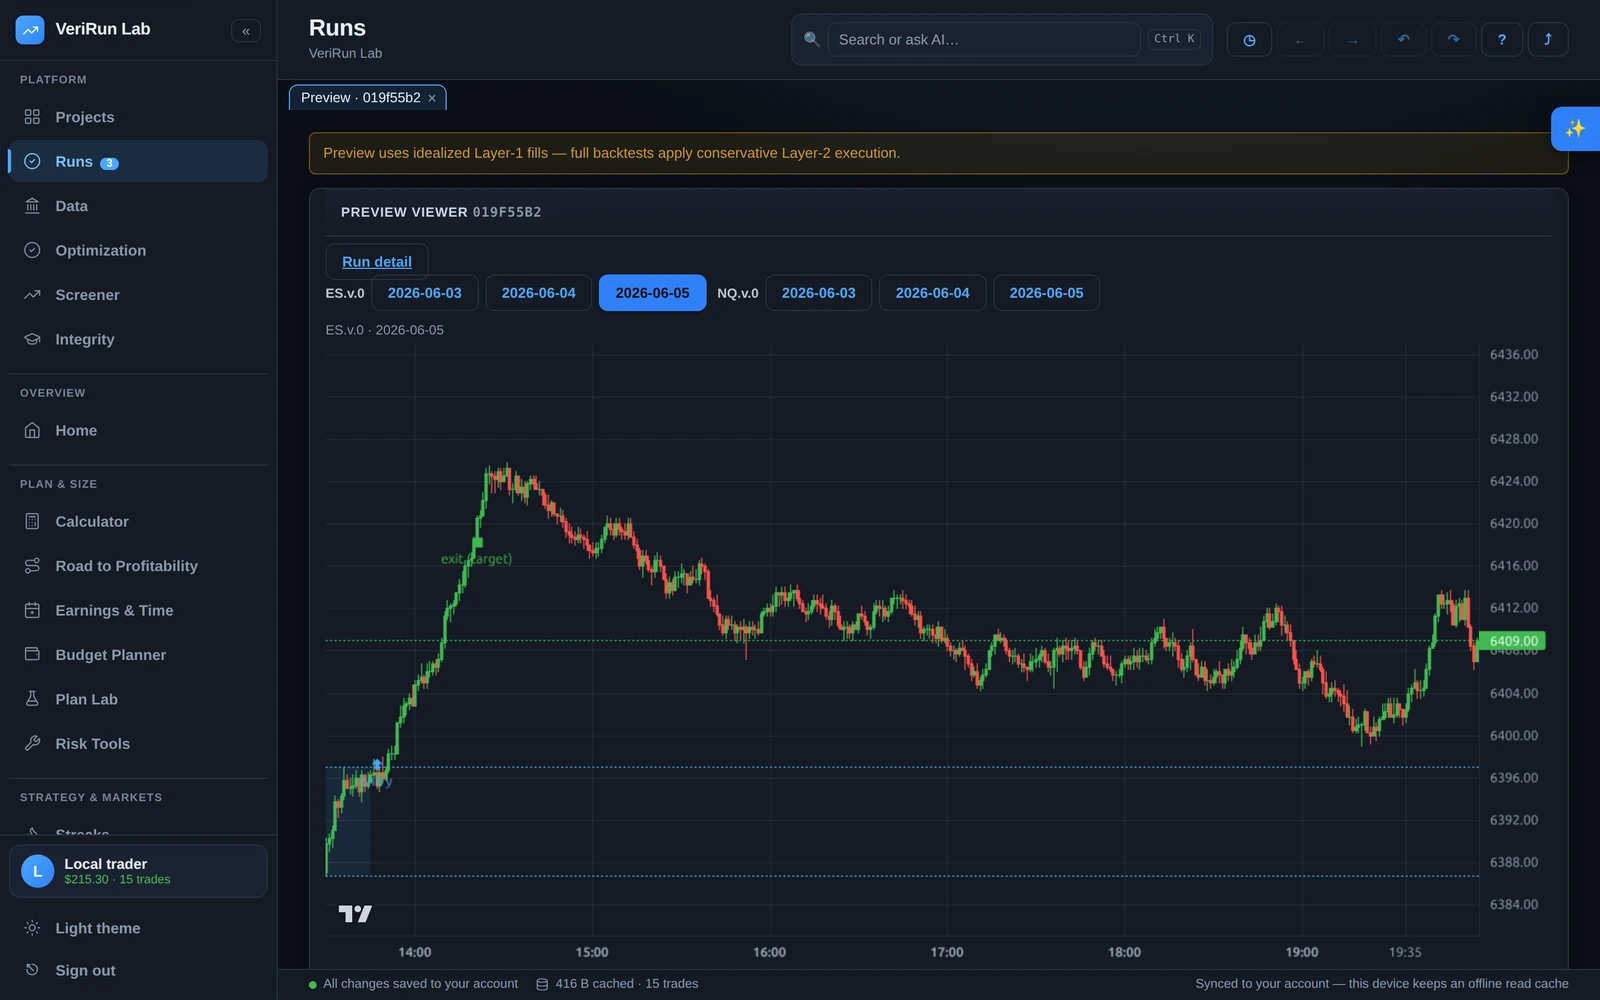
Preview results open a per-session chart with a tab per symbol and date. The visual vocabulary:
Markers
- Blue arrows — entries; the arrow points up for longs, down for shorts.
- Green markers — winning exits; red markers — losing exits.
- Amber markers — signals (a setup was detected).
- Gray markers — rejected setups: the pattern fired but no order ever filled or the setup was refused. The marker's text is the reject reason.
Lines
- Selecting a trade draws its entry (blue solid), stop (red dotted) and target (green dotted) price lines.
- Level lines show market structure your strategy used: point of control (amber), value-area high/low (dashed), opening-range high/low (blue dashed), swept levels (sparse dots), and VWAP (amber).
- Levels your strategy plots itself (
context.plot_level) draw as labelled segments from the bar they were plotted on, at every timeframe. A level that stood for less than one bar at the timeframe you picked is not drawn — stretching it would misstate how long it stood — and the chart says how many were left out (“2 levels too brief to show at 5m”); pick a finer timeframe to see them. - Your own
chart_annotationsdraw here too, on preview and backtest charts alike: entry/stop/target as per-setup price lines, every other level with the label you wrote (bounded to its start/end when you set them), markers at their time, and zones as shaded boxes with their label inside. This is where you verify the code sees the market the way you meant.
Panes
- Volume — per-bar volume histogram.
- Delta — per-bar buy-minus-sell volume, green/red by sign.
- CVD — cumulative volume delta as a line.
Your declared indicators, drawn
The engine charts draw the indicators the strategy actually declared, so the code and the picture agree at a glance. Overlays that belong on price sit on the price pane — VWAP variants, moving averages and their bands — while oscillators like RSI and MACD get their own panes below, and level studies (pivots, prior-day and overnight levels, the opening range) render as lines. This works the same for hand-written and AI-authored strategies: anything the builder or coding agent writes is fully backtestable and its declared indicators are drawn just like your own.
The chart fills the space it's given. Expand grows it to fill the pane and it reflows responsively as the window resizes, and Download saves the current chart as a self-contained file you can keep or share as-is.
The setups & trades blotter
Below the chart, Setups & trades lists every event: time, side (LONG/SHORT), outcome (win / loss / open), and a detail line with entry, stop, target and exit prices. Rejected setups appear as rows tagged with their reject reason and the note “rejected — no order worked”.
The debug trace and reject reasons
For custom strategies, the Debug trace panel shows, per setup, the
decision-relevant values your strategy's debug_trace method emitted —
each setup expands to reveal exactly what the code saw and decided. It is the
fastest way to answer “why did it (not) trade here?”.
Reject reasons you'll commonly see, and what they mean:
| Reason | Meaning |
|---|---|
no_profile | The level or profile the setup needed was never built, so no order could rest. |
no_rth_window | The level existed, but there was no valid regular-trading-hours window left for an order to rest in. |
no_fill_timeout | An order rested but expired without filling — price never came to it (or, in a backtest, never traded through it). |
rejected_geometry | The setup's price geometry was invalid — e.g. a stop and target arranged so the trade could never make sense. |
rejected_sizing | Your own risk rules refused the trade (stop too wide, size would exceed limits). |
Rejects are information, not noise
A strategy that detects 40 setups and fills 6 is telling you something important
about itself. If most rejects are no_fill_timeout, your entries may
be too passive for the pattern; if they're rejected_sizing, your
stops may be structurally too wide for your risk rules. Read the distribution,
not just the trades.
Backtest results at a glance
A finished backtest opens the results viewer with tabs: Overview, Equity (equity curve, daily net P&L and drawdown-from-peak charts, with optional buy-and-hold / random-entry benchmark overlays), Trades, Fills (the idealized-versus- conservative diagnostics), Gates (the scorecard — covered on the next page), Regimes, Sensitivity, Stress, Walk-forward and Provenance (the exact data slice, code version and parameters behind every number).