Run & evaluate
The run library
Runs are not throwaway. Every preview, test suite and backtest lands in the Runs section with its exact code version, parameters and data slice — searchable, comparable, exportable. This page covers organizing the library and, importantly, how to read the robustness views: regimes, stress, and price-path.
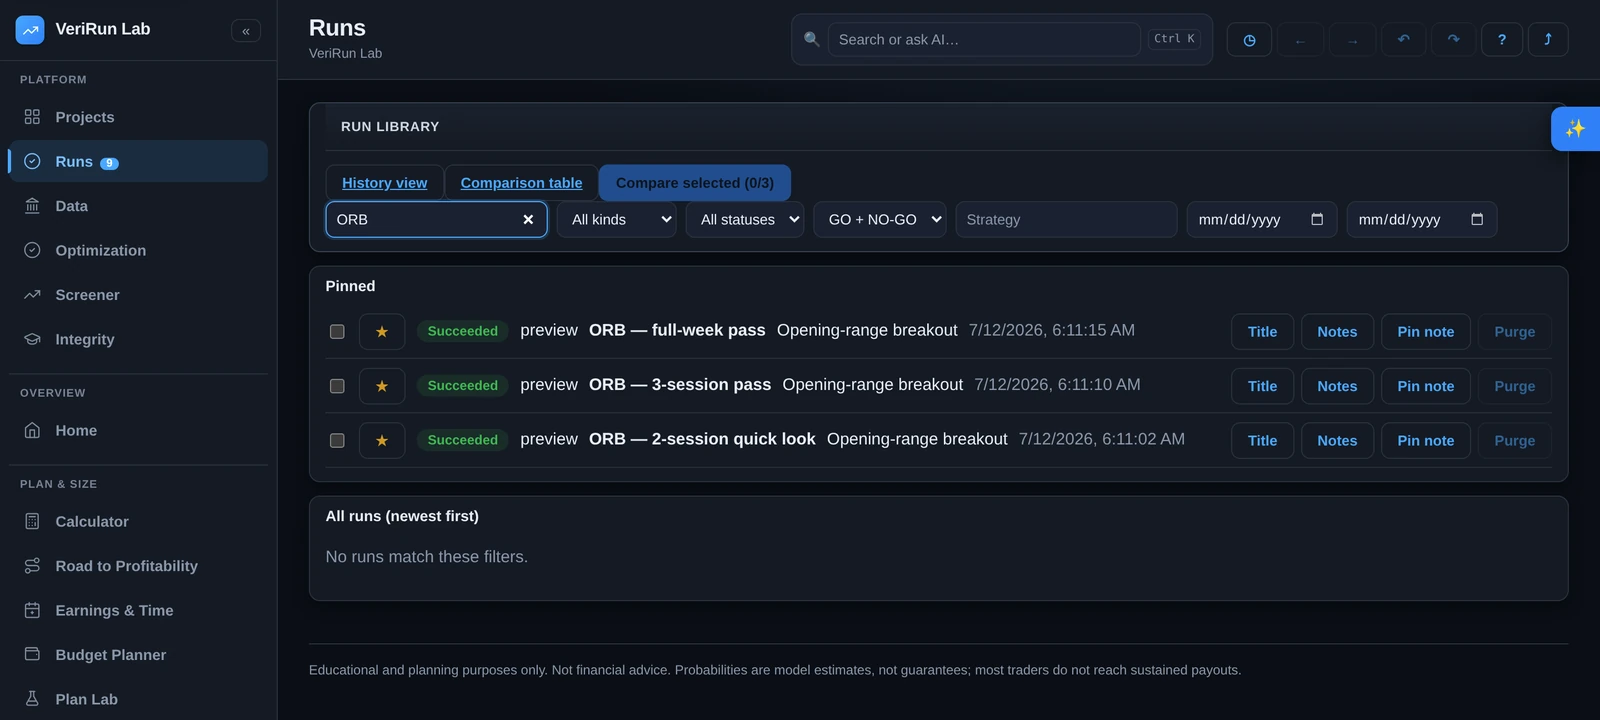
Finding and organizing runs
- Search and filters. Free-text search covers titles and notes. Filter by kind (preview / backtest / test / optimize / significance), status (queued, running, succeeded, failed, cancelled, timed out…), verdict (GO / NO-GO), strategy, and date range.
- Pin (★) what matters. Pinned runs move to the top of the library and are exempt from retention cleanup and purge — pinning is how you say “this is evidence, keep it”. Each pin can carry a private note (“Why does this run matter?”) displayed as Why pinned: …
- Title and annotate. Give runs meaningful titles inline, and use Notes for observations shared with your project.
- Purge deletes a run's stored results (with confirmation). Pinned runs can't be purged until unpinned.
When a run fails
A failed run tells you three things, and it is honest about the third when it does not know.
-
What broke, with the file and line. When your strategy raises,
the error card names the failing file and line
(
strategy.py:12) and the engine's real traceback expands underneath it — not an exit code. Paths are shown relative to your workspace; our container paths never appear. - Whose problem it is. If the failure was ours — a platform fault, a worker that died — the card says so plainly, tells you it was recorded for us to investigate, and does not offer to “fix” your code, because there is nothing in your code to fix. If the run stopped because the market data it needs is not in the catalog, it points you at the quoted download request instead.
- An honest “we do not know”. Many failures cannot be attributed reliably — a wall-clock timeout, for instance, is as often a runaway loop in a strategy as a slow platform. In those cases we make no claim at all and leave every option open, rather than guessing and sending you to debug code that was fine.
Fix with AI appears on failures that are yours to fix, and opens the AI edit lane pre-filled with the real error. Any proposal still comes back for your review.
Comparing runs
Two comparison tools cover two different questions:
Compare selected (2–3 runs) — “what changed?”
Select two or three runs and press Compare selected. You get: per-run summary cards; an equity overlay (one color per run); an aligned stats table with deltas against the baseline run; a config diff (exactly which settings differ); and the gates side by side — decision, grade and reasons per run. The first selected run is the baseline; all deltas read “baseline → run”. The URL is shareable and bookmarkable.
Comparison table (any number) — “what's the landscape?”
The Comparison table shows one row per run and instrument, with sortable columns — trades, expectancy (R), profit factor, win rate, net P&L, Sharpe, max drawdown — plus the verdict. Click a column to sort; expand rows to overlay their equity curves. Use it to survey a whole family of experiments at once.
Exporting
From a run's results you can export CSV (stats), CSV (trades), JSON or XLSX; comparison pages export their tables as CSV. You can also generate a self-contained HTML report bundle (stats, gates verdict, equity/drawdown charts, provenance) from Share & report, and mint expiring read-only share links for teammates — links are revocable, every access is logged, and viewers still need to sign in.
Individual charts have their own controls, separate from these data exports: any results chart can Expand to fill the pane — it reflows responsively as the window resizes — and each one downloads as a self-contained file you can drop into a report or share as-is.
The app's own metrics charts — equity curves, distributions, the sensitivity heatmap, the admin metrics grid — carry a separate full-screen control: a small expand button in the chart's top-right corner, which appears when you hover the chart and when you reach it with the Tab key. Escape, the close button, or a click outside brings the page back, and nothing about the chart is lost. Charts too short to host the button without covering their own data skip it — the community leaderboard's sparkline has none anywhere, and the small stat-card sparklines and the progress score gauge have none on a phone or tablet, where the button is a permanently painted 44 px target.
The equity tab's benchmark overlay
A strategy that made money isn't automatically a strategy that earned it. The results viewer's Equity tab overlays a benchmark on both the equity and drawdown charts — on by default, drawn as a dashed line under your curve — so “did it beat doing nothing?” is always in frame:
- Buy & hold (the default) — the run's own instrument(s) over the same window, priced from the same bars the run consumed. Multi-symbol runs get an equal-weight basket of the run's own symbols, with the legs named in the label. For new runs the series is cost- and capital-adjusted: your run's own starting capital split equally across the legs, the engine's commission rules applied per leg, and a round trip charged at each quarterly roll — so the comparison is same-capital, after costs. Older runs that only stored the raw engine series fall back to it (one frictionless contract per leg), and the info note says so plainly instead of pretending the costs were modeled.
- Flat (cash) — the zero line: “did it beat doing nothing after costs?” Its correlation renders as “—” with an explanation (a flat line has nothing to co-move with), never a number.
- Two display stats join the header while the overlay is on: Excess net (strategy net minus benchmark net) and Correlation (daily P&L), each with an info note stating exactly how it's computed. The header numbers themselves are display stats — but the audit computes its own stored twin of both as real verdict inputs (Benchmark excess and Benchmark correlation on the Audit tab): a strategy that failed to beat its own buy-&-hold basket after costs, or whose daily returns are mostly the market's, now shows it in the verdict, not just the chart.
- Your choice sticks. The Benchmark overlay checkbox turns it off, and the on/off state plus your chosen benchmark persist on the device where you set them.
The benchmark series is a stored run artifact — never recomputed, never a data purchase. The oldest runs, which stored only an end-of-window benchmark figure, render it as a marker line with a note; nothing is backfilled behind your back, and re-running the strategy produces the full per-day series. The drawdown pane gets the same dashed treatment, so a strategy that “wins” while drawing down worse than buy & hold is visible, not hidden.
"Explain this run" — a plain-English readback
Every succeeded backtest's Overview tab ends with an Explain this run panel: click Explain and the AI reads back the stored record — the headline numbers, the go/no-go decision and its reasons, every audit check by name, and the reality verdict when one exists — in plain English. It cites what the platform concluded and never softens it: a flagged verdict stays the headline. Nothing is recomputed, nothing is stored, and each click is one metered AI call under your quota (the panel says so before you spend it). The Audit tab remains the evidence; this is the narration.
The robustness views — and how to read each one
A single graded number can hide a fragile strategy. The results viewer's robustness tabs each attack the result from a different direction. None of them change the stored grade or verdict; they exist to tell you how the result might be wrong.
Regimes — “when does this strategy work?”
The Regimes tab slices the run's own trades by the kind of day and moment they happened in: session type (trend vs range), volatility versus recent sessions, close versus session VWAP, prior-day range position, opening-range expansion, contract-roll windows, liquidity, order-flow skew, time of day, day of week. Each slice shows trades, expectancy, profit factor, win rate, drawdown and net.
How to read it:
- Tight dispersion across slices — expectancy roughly similar everywhere — suggests a robust edge that doesn't depend on catching one kind of day.
- Wide dispersion — all the profit in one slice — means the “edge” is really a bet on that regime. That's not disqualifying, but you should know it, and the regime had better be identifiable in advance.
- Slices with too few trades are withheld (“insufficient sample — statistics withheld”) rather than shown as noise. Slices are descriptive research cuts, not promises.
Stress — “how does this die?”
The Stress tab replays the run's own stored trades through a battery of harsher what-ifs: extra slippage and commissions, randomly missed fills, resampled trade orderings, best winners removed. Press Run stress tests; each scenario gets a verdict — survives, fails, or informational — and findings are grouped into named warnings such as Cost sensitivity, Overfitting risk, Profit concentration and Fill realism.
How to read it:
- The baseline column is what actually happened; every stressed column is a labeled hypothesis, not a re-run of reality.
- A strategy that dies the moment costs rise a notch has no margin for the real world's frictions.
- If removing the top handful of winners flips the result negative, the “edge” was a few lucky trades (Profit concentration).
- A passing battery is a robustness argument — never a forecast.
Price-path robustness — “was it tuned to this exact tape?”
The price-path check re-simulates the strategy on altered copies of the price window itself — jittered, resampled, block-shuffled — usually a few hundred of them. If the strategy's logic captures something real about how the market moves, it should perform comparably on paths that preserve the market's character but not its exact sequence.
How to read it:
- The verdict is either holds up or likely overfit. The table shows your original path's result against the distribution across altered paths (best 5%, median, worst 5%, and a p-value).
- The key tell: if the original result beats even the best 5% of altered paths, the result is consistent with being tuned to that exact path — the app flags this rather than hiding it.
- These probes run with idealized fills for speed — they are directional evidence about overfitting, never a restatement of the run's real, conservative results.
Every robustness tab has a built-in reading guide
Each tab ends with a collapsible “How to read this” section written in plain language. If a panel ever feels ambiguous, open it — the guide answers the exact question the panel raises.